R&D in Review: Global Investment Trends
 Dec. 17, 2024—With the new year approaching, it’s an ideal time to look back on the trends that define research and development (R&D) investment in the United States and abroad. Insights from global R&D expenditure data can help inform decisions and direct the actions that will shape the future landscape, including talent and infrastructure considerations. Charting future strategies always requires that leaders assemble the big picture from smaller snapshots spanning several recent years’ data.
U.S. spending
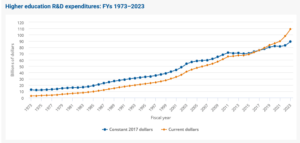
The National Science Foundation’s Higher Education Research & Development survey is an annual census of R&D expenditures at universities and colleges. The most recent data shows that 2023 spending grew at the largest annual rate since 2003, increasing 11.2% compared to the prior year. Spending in 2023 reached $108.8 billion, $11 billion more than in 2022. R&D funding by businesses was up 9.2% in 2023, accounting for around 6% of total R&D expenditures at universities. The most recent data on overall U.S. trends covers 2022, during which the United States performed R&D valued at an estimated $885.6 billion. Business R&D performance data also covers 2022 and shows expenditures reached $692 billion, a 14.8% increase over 2021. Nearly 80% of total business R&D spending went to development, with only 6% and 15% spent on basic and applied research, respectively.

Source: National Center for Science and Engineering Statistics, Higher Education Research and Development Survey.
Five industries accounted for 79% of U.S. business R&D expenditures in 2021:
- Information (including software) at 25%;
- Chemicals manufacturing (including pharmaceuticals and medicine) at 18%;
- Computer and electronic products manufacturing (including semiconductors) at 17%;
- Professional, scientific, and technical services (including contract R&D services) at 11%; and
- Transportation equipment manufacturing (including motor vehicles and aerospace products and parts) at 8%.
Global data
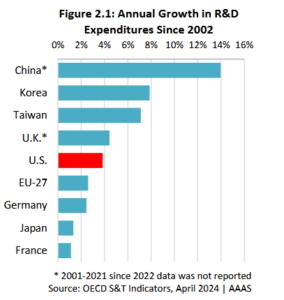
According to a report from the American Association for the Advancement of Science, which incorporates data from the OECD, global R&D investment reached over $2.2 trillion in 2021 (the OECD data includes private [business], public [government], and other sources). In terms of R&D expenditure growth, China reported the highest rate of increase (14%), followed by Korea, Taiwan, and the U.K. It’s important to note that China is not an OECD member country, so it did not submit data according to the same reporting standards as other countries. The United States remains in fifth place in terms of growth and has seen its annual R&D expenditure grow an average of 3.8% annually over the last 20 years.
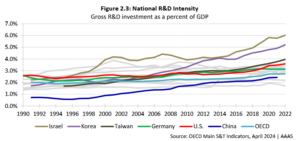
Some data sets also quantify research intensity, which measures R&D expenditures as a proportion of the country’s GDP. The standings for global research intensity, therefore, are different from total expenditures and the rate of R&D expenditure growth data. The top three countries for research intensity are Israel (6.02%), Korea (5.21%), and Taiwan (3.96%). The United States is fourth (3.59%), despite its much larger total outlay (China did not report comparable data in 2022). These countries’ R&D intensity, however, continues to rise, indicating their recognition of the importance of research investment.
While some nations have decreased federal research spending post-pandemic, private funding for research has increased as a percentage of GDP almost across the board (only Austria saw a decrease in private R&D funding). Korea, which leads the world in private R&D intensity, leveraged public policy changes (tax reform) to attract innovation-focused industries. In the United States, the 1981 R&D tax credit initiated the ensuing period of steady increase in business investment in research as a percentage of GDP (although the lion’s share, as stated above, is in development, not basic research).
Why it matters
Global research expenditures are a key indicator of the trends shaping the research landscape, helping to inform decision-making at both organizational and national levels. These insights can also guide strategies for government funding and direction for cross-sector collaborations. Of paramount importance is that R&D funding can lead to new products and services that improve peoples’ lives. For a comparative snapshot, see last year’s 3-Minute Read exploring research expenditures.
We want to hear from you. How will research funding change for your organization in 2025? Let us know on LinkedIn.
The 3-Minute Read is a UIDP member information piece and does not represent the opinions of our members or representatives. We welcome your comments on our LinkedIn profile.
Editor’s note: Look for the next UIDP 3-Minute Read in 2025. Happy New Year to all!


